
2013 Fantasy Baseball, Hold or Fold: R.A. Dickey
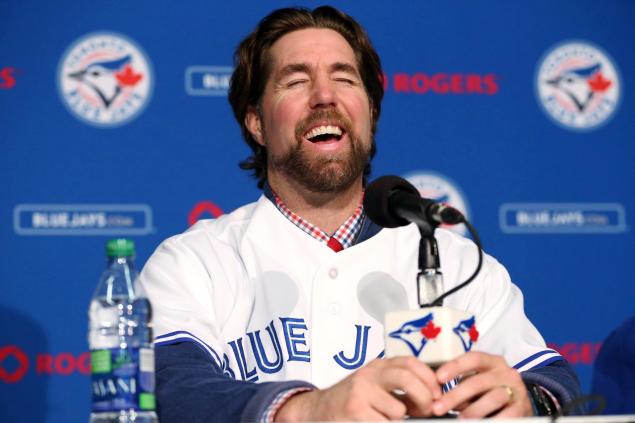
We turn our attention in the hold and fold series to another struggling starting pitcher. Things in Toronto were supposed to be a lot different this year. They added the likes of Jose Reyes, Melky Cabrera, R.A. Dickey, Josh Johnson, and Mark Buerhle in order to vault themselves to the top of the AL East standings. Dickey in particular was supposed to benefit from moving to a winning team with a very good offense. So far, those visions have been blurred by injuries and true ineffectiveness.
Fantasy players bought into the hype as Dickey was rated 49th on the pre-draft rankings in Yahoo and ranked similarly throughout the blogosphere depending on who you asked. That put him somewhere between tenth and fifteenth among starting pitchers. So, most observers thought there would be a regression for Dickey, but most thought he would still be among the better pitchers in baseball. Currently, he ranks 1174th in the fantasy baseball rankings with a win and a 5.82 ERA in three starts.
If you did not catch the opening of the series (Roy Halladay) there are a couple of things you need to know first. Number one, I do not trust small sample sizes, so I will not address 2013 at all. Secondly, you will notice that I will go through a few dimensions of performance to get to the bottom of what is likely to happen from here on out. We’ll start skin deep and move closer and closer to the core as we go. First, let’s take a look at the typical fantasy categories that people have to deal with in their leagues.
|
Wins |
ERA |
WHIP |
SO |
QS |
|
| 2008 |
5 |
5.21 |
1.558 |
58 |
6 |
| 2009 |
1 |
4.62 |
1.617 |
42 |
0 |
| 2010 |
11 |
2.84 |
1.187 |
104 |
19 |
| 2011 |
8 |
3.28 |
1.227 |
134 |
22 |
| 2012 |
20 |
2.73 |
1.053 |
230 |
27 |
Those that have studied Dickey know that he began to turn things around in 2010. So, 2012 is hardly a one trick pony, but it does stand out in many respects. In particular, we just can’t expect to see those kind of strikeout totals again. The history of it is staggering because you simply don’t see knuckleball pitchers with that high a strikeout rate. When you put it next to his microscopic walk rate (as we will see soon) it defies all explanation. That all adds up to a WHIP that is simply unsustainable. Given his performance in the last three seasons, we could probably expect a WHIP somewhere between 1.20 and 1.25.
Part of that comes from moving to the most difficult division in professional sports. Even if he maintained a high level of performance, we would have to expect regression on that basis alone. Now, there is nothing wrong with a pitcher that has a WHIP of 1.25. That is still better than the league average and even if the ERA were to go up half a run from his 2011 total we would still celebrate Dickey as a good starting pitcher. Add in good run support in Toronto and you are likely dealing with a 10-15 win pitcher.
However, there is an additional layer of numbers that could help us predict the future for Dickey. The fantasy numbers are great, but they aren’t necessarily the best predictors for future performance. Fielding Independent Pitchers (FIP) and fielding independent pitching with neutral home run rate (xFIP) are better predictors of future performance than ERA. Additionally, looking at batting average on balls in play (BABIP) and left on base percentage (LOB%) can help us see if he benefitted from good luck or if the performance was geniune.
|
FIP |
xFIP |
BABIP |
LOB% |
HR/9 |
HR/FB |
|
| 2008 |
5.25 |
5.15 |
.291 |
71.8 |
1.20 |
10.8 |
| 2009 |
4.99 |
4.91 |
.316 |
76.5 |
1.12 |
10.7 |
| 2010 |
3.65 |
3.75 |
.276 |
77.3 |
0.67 |
8.5 |
| 2011 |
3.77 |
3.95 |
.278 |
75.1 |
0.78 |
8.3 |
| 2012 |
3.27 |
3.27 |
.275 |
80.0 |
0.92 |
11.3 |
Sometimes you can waste a great deal of time trying to define league norms for numbers. Simply looking at a player’s numbers by themselves can tell you a great deal. For instance, Dickey’s left on base percentage for 2012 sticks out like a sore thumb. We could pontificate for hours on whether that is a pure luck stat or if it is dependent on a pitcher’s skill, but his own performance history suggests that 80 percent is unsustainable. If he floats back to 75 or 76 percent then he will see more runs added to his ERA.
In a similar way, the BABIPs for the last three seasons fall below league norms, but also his own norms from the previous two seasons. Both of those occurred in the American League and when you add in the left on base percentage you see we can expect regression. Fortunately, the home run rates are both around league average and career norms, so we shouldn’t see increases there.
Mind you, none of these numbers indicate you should drop him, but he shouldn’t have been your first starting pitcher taken. If he was you will simply have to deal with the fact that Dickey will not perform like an ace. His 2010 and 2011 numbers do suggest he should remain a better than average starting pitcher. Better than average starting pitchers on good teams still have a great deal of value. Yet, when you look at the pitch f/x data you will see a considerable jump in his 2012 performance.
|
K% |
BB% |
LD% |
FB% |
Contact |
SwStr |
|
| 2008 |
11.6 |
10.2 |
17.1 |
36.5 |
85.9 |
6.3 |
| 2009 |
14.3 |
10.2 |
18.1 |
34.9 |
85.1 |
6.5 |
| 2010 |
14.6 |
5.9 |
16.8 |
28.0 |
82.0 |
8.4 |
| 2011 |
15.3 |
6.2 |
16.2 |
32.9 |
83.5 |
7.8 |
| 2012 |
24.8 |
5.8 |
19.8 |
34.1 |
75.2 |
12.2 |
Again, we could wander aimlessly while we define the league average or we can simply eyeball the numbers. Whether you knew the league average for strikeout rate and walk rate, you can tell that 2012 was an abnormally large shift. Simply put, I don’t trust large shifts. I do trust the fact that he has steadily improved in strikeout rate (and swinging strikes) before 2012. I think that overall trend will improve even as we see his 2013 numbers drop. We will likely see a strikeout rate around 16 percent with a swinging strike rate of around nine percent. Both are decent enough numbers even if they don’t equal his 2012 totals.
Given that he will be facing some of the best teams in baseball multiple times and given the recent results, he will be hit hard at times. On the bright side, he has a walk rate well below the league average (ten percent) and that should continue as it has since 2010. If you walk fewer hitters and keep the ball in the ballpark then you have a fighting chance of winning even you do get hit hard sometimes.