
The Rubber, Week Eight: Potential K% Surgers and Losers
We all know there is a strong correlation between swinging strike rate (SwStr%) and strikeout rate (K%). But how strong is it? And how can we take that correlation and determine which players are most likely to see a rise or fall in strikeout rate going forward based on their ability to miss bats?
To determine how strong the correlation between K% and SwStr% really is I compiled a sample of all starters who faced 210 batters or more from 2010-2012. I chose 210 because 70 batters faced is the point at which strikeout rate becomes stable in a season. But the floor could have been higher and the result would have largely been the same. Below is a graph showing the correlation between K% and SwStr% in that sample.
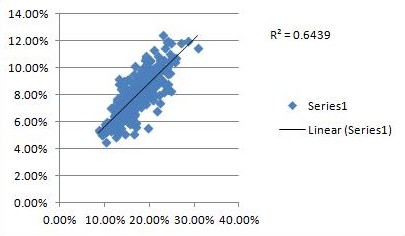
If you’re not familiar with what that R2 number means, it basically means that SwStr% explains about 64% of the variance in K%. That’s a very strong correlation. I test for correlations between numbers all the time and rarely get anything that high. Almost anytime an R2 is over .50, it’s significant. We knew there was a strong correlation, but know we’ve verified it and know exactly how strong it is.
The next step is to take this knowledge and see who is under and over performing in strikeout rate so far. To make that determination I started by calculating the slope of the line in the graph above. The slope is just a value indicating the steepness of the line. The higher the value, the steeper the line will be. Here the slope is essentially 2 (1.9648). This means that for every increase of one percentage point in SwStr% we should expect to see an increase of two percentage points in K%. For example, if a pitcher has a 10% SwStr%, we should expect him to have a 20% K% (20/10 = 2).
I took all starters who have faced 70 or more batters this year and multiplied their current SwStr% by 1.9648, which, again, is the slope of the line in the graph above and the relationship we should expect to see between SwStr% and K%. I called that number expected K% (xK%). Then I calculated the guys with the biggest gaps between their actual K% and their expected K% to identify who is most likely to see a rise or fall in K%. Below are the starters whose xK% is more than one standard deviation from the mean in either direction.
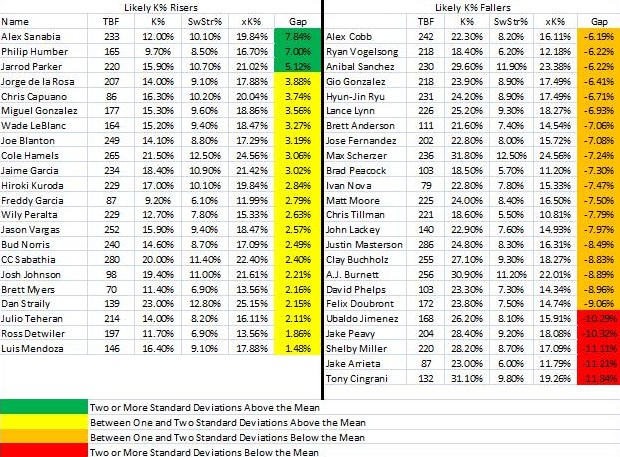
Let’s start with the guys on the extremes. First of all, my boyfriend, Jarrod Parker! I loved Parker this preseason. I drafted him in a ton of leagues. I recommended him to all my friends who had drafts. I wrote about my love for him several times here on the site. And so far he’s made me look stupid. But this gives some hope. The league average K% for starters is currently an even 19%, and Parker’s SwStr% indicates his K% should be safely above average at 21.2% instead of 15.9% where it is now.
It’s also worth noting that Parker saw his velocity increase significantly from the beginning of last year to the end. His velocity this year is right in line with his averages from last year, but if it increases as we move into summer, he could potentially see more swinging strikes and strikeouts than this exercise even forecasts.
Admittedly, Parker may be failing to rack up strikeouts at the rate we think he should because of his struggles with command. His walk rate is in double digits so far this season due in some part to the fact that he’s not inducing hitters to swing at a high enough rate. The Swing% of batters against Parker this year is 45.4% compared to 48% against all starters. He obviously gets them to miss more often than most when they do swing, but he’s got to be more consistent with his control so that they will swing more often.
Parker is only owned in about 26% of ESPN.com ten-team leagues, so we’re not really talking about him as a trade target in 10 and 12 team leagues. He’s likely owned in leagues deeper than that and worth trying to trade for if you’re looking for cheap pitching help. But if your rotation is struggling in shallower leagues and you can’t seem to work out a trade for pitching, you might add Parker and see if he can turn it around.
On the other side of things, Jake Peavy and Shelby Miller stand out as potential guys to trade away.
Peavy’s 28.4% K% is well above his career average, and he hasn’t had a K% above 25% since 2009. In 2009 he had a SwStr% of 10.2%. This year his SwStr% is only 9.2%, which is right about where it was in each of the last two seasons when his strikeout rates were 20.2% and 22%. There is little doubt in my mind that Peavy’s K% will return to that 22% range. And that’s a more than respectable rate. But maybe there’s a chance you could deal Peavy for someone who actually has a chance to maintain a K% near 25%.
For example, how about someone who appears on the good side of the list like Cole Hamels? I’ve actually discussed Hamels in each of my last two pieces here on the site (which you can find here and here), and in each of them I cited two other reasons why he should bounce back that had nothing to do with SwStr%. Who knows if you could actually get Hamels for Peavy? But it can’t hurt to try. Offer it.
What about offering Peavy for Hiroki Kuroda? This one isn’t as easy as the decision to try and trade him for Hamels, but it’s something you should consider. Compare the numbers below of Peavy and Kuroda since the beginning of 2012.

Peavy has a clear edge in strikeouts, but Kuroda has a sizeable advantage in two of the four roto categories, wins and ERA, while WHIP is essentially a wash. Given the fact that Kuroda’s expected K% for 2013 is higher than Peavy’s it’s not unreasonable to expect Peavy’s strikeout advantage to diminish. You might be hesitant to offer Peavy for Kuroda, but you probably should. If you can’t get Hamels of course.
A.J. Burnett, Clay Buchholz, Justin Masterson and Matt Moore join Miller as the other big “sell” candidates. Of that quartet, Moore should be the easiest to sell. He has that sexy young gun persona and a 2.29 ERA that should make him an attractive guy to other owners. You should try to trade him for Hamels as well. If you can’t get Hamels, you should go for another name on the “good” list, CC Sabathia.
Miller has a similar if not quite equal persona and an even sexier 1.74 ERA. But Moore has a little more name value and has been around a little longer. Hamels and CC owners probably won’t bite on Miller. But they might bite on Kuroda, and swapping Miller for Kuroda would be an absolute coup in my opinion. Kuroda’s 1.99 ERA might make him unattainable for Miller as well as for Burnett, Buchholz and Masterson. If you can’t get Kuroda for them, try for guys like Doug Fister and Jeff Samardzija.
Thanks as always to Fangraphs for the data.