
The Rubber, Week Seven: Examining Changes in Walk Rate

A week ago today, Russell Carleton (@pizzacutter4) posted a piece at BaseballProspectus.com showing when certain pitcher statistics become reliable. The methodology is somewhat complicated, and I suggest you click through to that piece and read through the full explanation. But the main point of the article is that there is a point at which stats stabilize. What does that mean? It means that after a certain number of batters faced, we can be sure that the statistic is a true reflection of a player’s skill.
We’ve reached the point in the season where most qualified pitchers have crossed the 170 batters faced threshold that shows when walk rate has stabilized. As Carleton puts it, we can’t say that a pitcher’s walk rate the rest of the season will be what it has been in the first 170 batters faced. He says that is an assumption but not necessarily a bad one.
The way I interpret this information is that something is definitely different with the pitchers who have seen big changes one way or the other in their walk rate. I don’t expect their walk rates the rest of the season to be exactly like they have been so far this season. The career rate is still a larger and more reliable sample, but I would expect most of these guys to continue to see an elevated walk rate, even if it doesn’t continue to be quite as elevated as it has been through 170+ batters faced.
_______________________________________________________________________________________________________
Alright, enough explanation; let’s look at some names. There were 105 starters who had crossed the 170 batters faced threshold after Tuesday’s games. I took those 105 starters, calculated the difference between their career and 2013 walk rates, and then identified those pitchers whose change in walk rate is more than one standard deviation away from the mean in both directions. The pitchers on both extremes are listed below.
| Name |
BB% |
Career BB% |
Gap |
Name |
BB% |
Career BB% |
Gap |
|
| Bartolo Colon |
1.06% |
7.98% |
6.92% |
Edwin Jackson |
11.39% |
9.35% |
-2.03% |
|
| Kevin Correia |
3.69% |
8.60% |
4.91% |
Juan Nicasio |
10.11% |
7.91% |
-2.20% |
|
| Ervin Santana |
3.08% |
7.89% |
4.81% |
Ian Kennedy |
9.86% |
7.64% |
-2.22% |
|
| Adam Wainwright |
2.18% |
6.99% |
4.80% |
Patrick Corbin |
8.57% |
5.65% |
-2.92% |
|
| Matt Harvey |
6.80% |
10.61% |
3.82% |
Lucas Harrell |
13.27% |
10.22% |
-3.05% |
|
| Julio Teheran |
4.95% |
8.64% |
3.70% |
Jarrod Parker |
11.86% |
8.67% |
-3.19% |
|
| Anibal Sanchez |
5.69% |
9.24% |
3.56% |
R.A. Dickey |
10.43% |
7.18% |
-3.25% |
|
| Mike Minor |
4.98% |
8.52% |
3.55% |
Alexi Ogando |
9.73% |
6.20% |
-3.52% |
|
| Jake Peavy |
4.49% |
7.90% |
3.41% |
Wade Miley |
9.31% |
5.41% |
-3.91% |
|
| Ross Detwiler |
4.97% |
8.29% |
3.32% |
Cole Hamels |
10.60% |
6.67% |
-3.93% |
|
| Shelby Miller |
6.29% |
9.52% |
3.24% |
Kris Medlen |
8.97% |
5.04% |
-3.93% |
|
| Max Scherzer |
4.92% |
8.09% |
3.17% |
Jon Niese |
11.46% |
7.45% |
-4.00% |
|
| Bronson Arroyo |
4.21% |
7.16% |
2.95% |
C.J. Wilson |
13.96% |
9.77% |
-4.20% |
|
| Brandon McCarthy |
3.72% |
6.67% |
2.95% |
Alex Sanabia |
12.36% |
5.83% |
-6.53% |
|
| Alex Cobb |
5.15% |
8.07% |
2.92% |
|||||
| Felix Hernandez |
4.47% |
7.38% |
2.91% |
|||||
| Barry Zito |
7.29% |
10.15% |
2.86% |
|||||
| Derek Holland |
5.02% |
7.81% |
2.78% |
|||||
Unsurprisingly, a lot of the guys who show up with the biggest positive gaps between their 2013 and career walk rates are guys who have gotten off to hot starts and outperformed preseason expectations. For example, Wainwright, Anibal, Minor, and Peavy were all expected to be good, but they’ve been even better than expected. These numbers also back up the strong performances we’ve seen from Cobb and Holland so far. And you also see the names of young starters beginning their first full season campaigns in Harvey, Miller and Teheran. Their career sample is so small that those are the names you should expect to maintain a walk rate most similar to their 2013 rate.
Last week I looked at guys on the extreme ends of BABIP and found that Brandon McCarthy is a nice buy-low option. McCarthy once again shows up on the good side of this study. He threw eight shutout innings against Philadelphia on Sunday, so he may be well on his way to turning it around. He pitches against the Marlins in Miami on Saturday and is owned in less than 20% of ESPN leagues. Add him.
_______________________________________________________________________________________________________
The “bad” list is much more interesting to me. For the most part, you see guys who are off to rough starts. We’ll address them in a minute, but you also see a couple of names that look out of place. Corbin and Ogando are off to very good starts, but their owners probably wish they appeared on the left side of the chart. Alas, their walk rates do no back up their hot starts. I wrote in detail about why Ogando is a sell-high on the site last week. As for Corbin, he needs his walk rate to be well above-average like it was last year because his strikeout ability is just average. Without the control, it’s hard to envision Corbin having an ERA much below 4.00 from here on out.
Aside from Ogando and Corbin, the right side of the list is full of guys who are struggling so far this year. The walk rate may not be their only problem, but it’s obviously contributing to their struggles. What I wanted to know is why these guys have seen such a negative shift in their control. The first thought I had was that they might also be suffering from a loss in velocity. This is somewhat counterintuitive because often guys will voluntarily cede a little velocity in order to harness some control. But I thought an involuntary drop in velocity might come along with a loss in control given that a pitcher might have a hard time adjusting to an unexpected loss of velocity. As it turns out, all but three of the 11 struggling pitchers have also seen a drop in velocity from last year, six of them somewhat significantly so.
|
2013 |
2012 |
||
| Name |
vFA |
vFA |
Difference |
| Cole Hamels |
91.3 |
90.9 |
0.4 |
| Ian Kennedy |
89.6 |
89.2 |
0.4 |
| Kris Medlen |
89.6 |
89.6 |
0 |
| Wade Miley |
91 |
91.1 |
-0.1 |
| Jarrod Parker |
92.3 |
92.4 |
-0.1 |
| C.J. Wilson |
91 |
91.6 |
-0.6 |
| Edwin Jackson |
92.8 |
93.4 |
-0.6 |
| Lucas Harrell |
91.6 |
92.2 |
-0.6 |
| Jon Niese |
89.6 |
90.5 |
-0.9 |
| R.A. Dickey |
81.9 |
83 |
-1.1 |
| Juan Nicasio |
92.3 |
93.4 |
-1.1 |
What you should take away from this list is that the guys with a loss of 0.6 or more are not buy-low candidates. Specifically, Dickey, Niese, and Wilson – pitchers who have had some nice success in the past – are not buy-low candidates. The others might not be guys you should completely give up on just yet, but I’m skeptical because their lack of control could be unrelated to velocity. You’re probably very wary of Parker, Miley, Medlen and Kennedy, so it shouldn’t be hard to convince you to be cautious with them. But a lot of you might think Hamels is someone you should actively pursue. I’m inclined to agree with you, but there is one concern.
_______________________________________________________________________________________________________
Hamels’ velocity is basically the same as it has been the last two years. His pitch mix is about the same as well. On the surface, it seems like Hamels might be in line to rebound. But one big difference jumps out on his Brooks Baseball page. Hitters are laying off his changeup much more often which is resulting in more balls when he throws that pitch. Last year hitters swung at his change 62.5% of the time, and the pitch resulted in a ball 25% of the time. This year hitters are swinging at the pitch just 53.88% of the time, and the pitch has resulted in a ball about 36% of the time.
This is interesting because Hamels had an issue with his release point last season. As the season wore on, his release point moved in towards his body. That shift is best depicted by a screenshot of his changeup release points last year.
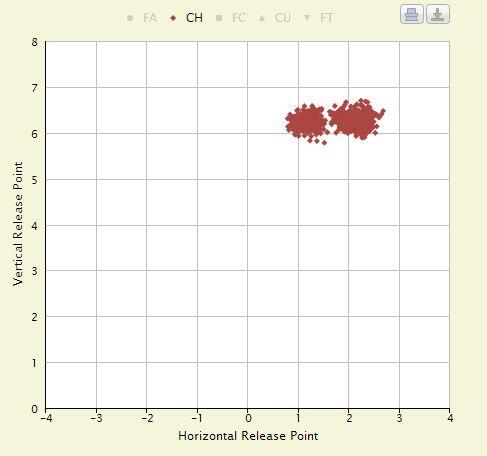
The grouping to the left reflects his release point early in the season, and the grouping to the right reflects the shift in towards his body as the season moved along. His other pitches also followed this pattern for the most part.
It’s hard to say whether this obvious issue with his release point is helping hitters identify his changeup. His release point on all pitches this season has been largely in towards his body just like it was at the end of last year when his walk rate was fine. But it seems clear that hitters are identifying his changeup and laying off it more often. I may be reaching by using his release point as an explanation. But whatever the explanation actually is, it is clear that his changeup is less effective. Given that he throws it about a quarter of the time (his second most frequent pitch), that’s a big problem.
Hopefully, Hamels is just suffering from a mechanical issue that is tipping hitters of to his changeup. Maybe it’s his release point or maybe it’s something else like his arm speed. If that’s all it is, that can be fixed, and Hamels can certainly bounce back.
Long story short: keep an eye on how often Hamels can get hitters to offer at his changeup.
1 Comment
got Cole’s autograph yesterday but he wasnt talking about arm slots and release points…maybe his wallet is throwing off his stride this year?
he is just not hitting his spots right now, and his curveball doesnt look sharp either….
corbin’s era of course has to jump, just a matter of how much; while his walks are up, his homeruns are down from 14 to 2 in half as many innings this year…so maybe in an effort to keep the ball out of hitters happy mode, he’s walking a little more…would you trade a 3% increase in walk rate for a 70% decrease in home run rate? also read his pitch allocation is alot different this year…