
Where is Chase Headed?
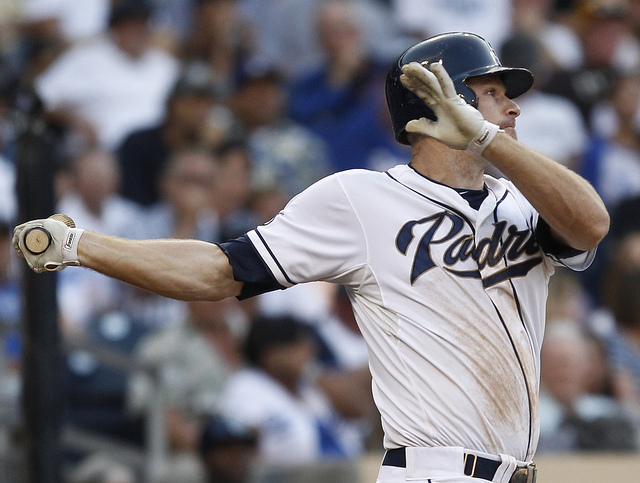
On Sunday afternoon, I thought about Chase Headley and his career. A hitter who showed strong power in the minors, but much less power in the majors. That was until 2012 of course. Then that same Sunday, I sprained my right foot (attempting a not too athletic move) playing basketball. Unable to sleep because of my injury, I fixated on Headley’s season. My investigation went through the wee hours of Sunday night/Monday morning, in hopes to find where Chase’s 2013 was headed.
Headley had a career year in 2012, but has so far struggled to regain that form in 2013. So, is he an ideal buy low candidate? Is he a one year fluke in the power department? Last season he hit 31 dingers with 17 steals. He never surpassed 12 homers in his major league career. But as mentioned, the Padres third baseman was once a prospect that showed very good power in the minors, and he tapped into that power last season. Is Headley doing anything different from 2012?
| Season | Team | O-Swing% | Z-Swing% | Swing% | O-Contact% | Z-Contact% | Contact% | Zone% |
| 2010 | Padres | 27.6 % | 61.1 % | 44.0 % | 59.5 % | 89.6 % | 80.0 % | 49.0 % |
| 2011 | Padres | 25.2 % | 62.5 % | 42.4 % | 59.9 % | 89.3 % | 79.9 % | 46.1 % |
| 2012 | Padres | 25.7 % | 67.2 % | 44.5 % | 52.0 % | 85.2 % | 74.7 % | 45.3 % |
| 2013 | Padres | 26.5 % | 64.7 % | 43.6 % | 53.7 % | 82.9 % | 73.1 % | 44.8 % |
| Total | – – – | 26.7 % | 63.3 % | 44.0 % | 55.7 % | 87.3 % | 77.2 % | 47.3 % |
| Season | Team | GB/FB | LD% | GB% | FB% | IFFB% | HR/FB |
| 2010 | Padres | 1.28 | 17.9 % | 46.1 % | 36.0 % | 6.4 % | 6.4 % |
| 2011 | Padres | 1.42 | 21.9 % | 45.8 % | 32.3 % | 6.5 % | 4.3 % |
| 2012 | Padres | 1.51 | 19.5 % | 48.5 % | 32.1 % | 6.9 % | 21.4 % |
| 2013 | Padres | 1.32 | 20.4 % | 45.3 % | 34.3 % | 6.4 % | 10.6 % |
| Total | – – – | 1.29 | 19.5 % | 45.4 % | 35.1 % | 6.5 % | 10.2 % |
There isn’t too much difference from 2013 to 2012 when it comes to his swing and batted ball profiles. Headley is making slightly less contact, but also has slight increases in line drives and flyballs. However, there is a noticeable drop in contact percentage since 2010. That could be a future red flag, but his 2013 and 2012 contact rates aren’t too far apart. It also helps that Headley’s walk and strikeout rates have remained about the same. We could assume that his current BABIP (.280) should bounce up since it is significantly lower than his career rate (.335). His HR/FB rate is currently cut in half from 2012, but still higher than in 2010 and 2011.
It also isn’t a surprise that Headley posted a career high ISO (.212) and flyball distance (304.47 feet) last season. He was just outside the top 10 in flyball distance, ranking at number 11. This year, his flyball distance is 286.29 feet and his ISO is .131. Both those numbers are slightly higher than what he did in 2011 (.110 ISO, 284 ft.), but basically right in line with what we would normally expect Headley to produce if last year never happened.
We also aren’t sure if there are any negative effects that still linger from the broken left thumb he suffered prior to opening day. Power metrics also take the longest to stabilize. Really, Headley could have a five homer bing this week, and suddenly he is back to being the player of last season. So, we could just say, “buy low, buy low!” But is the power actually going to come back?
For the most part, it seems like the switch-hitter has the same approach at the plate as he did last season, except this year the ball isn’t leaving the yard nearly as much. Headley said he made a change in 2012. In essence, he decided to try to pull the ball more and get more lift. Going through his hit chart, it seems like Headley is still pulling the ball like he did in 2012.
Thanks to MLB.com (San Diego Padres page), we can watch highlights of Headley’s at-bats. I am no scout. Nor am I qualified to be a hitting coach. I certainly don’t want to pretend to be either. But that doesn’t mean I, or you, can’t try to notice if something is up with his swing.
I looked through both his left and right-handed swings, but to keep this simple, let’s just look at the left side.
Here is a video from July 15th, 2012: http://wapc.mlb.com/play?content_id=23064473
And a video from May 1st, 2013: http://wapc.mlb.com/play?content_id=26772481
I looked through other videos, but I wanted to find two home run swings off similar pitches/locations. The only possible difference I see in the two swings are Headley’s legs. In the 2012 video, his front leg fully extends on contact. The back leg seems steady and balanced. In 2013, the front leg does not fully extend until shortly after contact, and the back leg may have a little less balance to it. I didn’t watch all of his home runs, but this seems to be consistent from the videos I did watch. This could just be a timing issue or a mechanical issue. I could also be reading too much into this or simply seeing something that isn’t there, therefore meaning little.
For the most part, Headley is doing what he did last season. And if we believe in the changes he made, shouldn’t the results follow to some extent? Hitting 12-15 homers the rest of the way isn’t a complete stretch. And 15 more will put him at the 20 home run mark. Power is the last tool to stabilize, and that includes the current decrease in his flyball distance. On the other hand, the evidence doesn’t look particularly promising when you include his past years, and some players do have outlier seasons. After all, we can’t forget Headley’s very mundane numbers. A player who in the recent past delivered about an average of 270 with 12 homers and 15 steals. So which direction is he headed?
The truth is probably somewhere in between. Headley may be closer to 20 homers this season, than 30, but not to the point of becoming a weak link on your fantasy team. If you drafted him before the thumb injury, you likely paid a steep price. But selling low isn’t an option right now. He is still a very valuable 3B if he hits 20 homers to go with 15 steals, and those numbers aren’t out of reach. Other Headley owners may feel they bought into something that isn’t real, and are ready to jump ship. If you need 3b/CI help, or want to take a gamble on adding some power (and some speed) by buying low on Chase Headley, it seems like a risk worth taking.
Thanks to Fangraphs.com and Baseball heatmaps for the data.
Thanks to http://msn.foxsports.com for the hit chart on Chase Headley.
Thanks to http://www.gaslampball.com (SB Nation) for the Chase Headley interview.
Thanks to MLB.com for the Chase Headley highlight videos.