
Yield to Zack Greinke’s Warning Signs

Hoping he can be their number two behind Clayton Kershaw, The Los Angeles Dodgers’ handed Zack Greinke a monster contract that closed in on $150 million over six years. So far, 2013 hasn’t gone as planned for either party. Before the season, Greinke dealt with an elbow issue, but managed to seemingly dodge a bullet. He avoided the disabled list and was able to pitch in the first week of the season. Unfortunately he wouldn’t couldn’t dodge the oncoming shoulder block delivered by Carlos Quentin. The right-hander suffered a broken left collarbone that cost him a month of the season. Since returning, his results have been mediocre at best, and warning signs may be mounting for Zack Greinke, his fantasy owners, and the Dodgers.
[am4show have=’p4;p7;p3;’ guest_error=’Front Office’ ]
Greinke has been treated like a piñata at times this season. Even Ian Kennedy got in on the act this past week. But fantasy owners aren’t getting any candy from their perceived ace. He has so far delivered an underwhelming strikeout rate (6.43 K/9), a lackluster ERA (4.22), and a ratio killing WHIP (1.41). A 4.37 SIERA and a 4.23 xFIP help back up the disappointing results.
Greinke’s swing and batted ball profile may tell some of the story.
| Season | Team | O-Swing% | Z-Swing% | Swing% | O-Contact% | Z-Contact% | Contact% | Zone% |
| 2009 | Royals |
30.3 % |
59.7 % |
44.5 % |
59.6 % |
87.7 % |
77.8 % |
48.1 % |
| 2010 | Royals |
28.4 % |
61.6 % |
44.7 % |
64.3 % |
91.2 % |
82.5 % |
49.0 % |
| 2011 | Brewers |
29.8 % |
61.6 % |
44.3 % |
54.4 % |
88.0 % |
75.7 % |
45.8 % |
| 2012 | 2 Teams |
28.5 % |
59.0 % |
42.3 % |
62.0 % |
89.7 % |
79.4 % |
45.1 % |
| 2013 | Dodgers |
26.4 % |
65.8 % |
44.3 % |
64.2 % |
85.4 % |
78.5 % |
45.3 % |
| Total | Career |
28.8 % |
61.0 % |
44.3 % |
60.9 % |
88.2 % |
79.0 % |
48.2 % |
Greinke could be doing a little better with his Swing and O-Contact percentage, but compared to his recent past and career, the differences aren’t drastic. In fact, his swinging strike percentage is at 9.5%, and is higher than both his 2012 and career percentage. But Greinke is walking a few more batters than usual. His first pitch strike percentage is down to 55.4% (league average is about 60%), which is about 7% less than his career average. And his Zone% has dropped about 4% since his 2010 season.
Writer Jeff Zimmerman explains that pitchers may be more susceptible to injury if their zone percentage is under 47%. So it is a concern that Greinke’s percentage has decreased below that threshold over the last few seasons.
|
Season |
Team |
GB/FB |
LD% |
GB% |
FB% |
IFFB% |
HR/FB |
| 2009 | Royals | 0.99 |
19.4 % |
40.0 % |
40.5 % |
9.5 % | 4.5 % |
| 2010 | Royals | 1.27 |
17.8 % |
46.0 % |
36.3 % |
8.8 % | 7.5 % |
| 2011 | Brewers | 1.54 |
22.0 % |
47.3 % |
30.8 % |
5.0 % | 13.6 % |
| 2012 | 2 Teams | 1.69 |
21.7 % |
49.2 % |
29.1 % |
9.1 % | 10.2 % |
| 2013 | Dodgers | 1.18 |
28.3 % |
38.8 % |
32.9 % |
12.0 % | 8.0 % |
| Total | Career | 1.13 |
21.0 % |
41.8 % |
37.2 % |
9.5 % | 9.1 % |
There are other noticeable changes when looking at the batted ball profile. His line drive% is very high, sitting at 28.3%. And his groundball rate shows a big drop when you compare it to his last three seasons. Is there a reason hitters are lacing the ball against Greinke?
One reason could be velocity. Greinke’s fastball is sitting at 90.7MPH. Compare that to his 93.7MPH in 2009, and that is a three MPH drop. Last season, his fastball was at 92.4. This is a significant drop in velocity. Unlike Justin Verlander, whose fastball velocity has been trending upwards, Greinke’s velocity has yet to show such a trend. We could blame the collarbone injury and give this a wait and see approach. But what about that elbow inflammation in March?
Take a look at Greinke’s slider usage this year compared to past seasons.
|
Season |
Team |
FA% |
FT% |
FC% |
SL% |
CU% |
CH% |
| 2009 | Royals |
58.9 % |
0.5 % |
0.4 % |
19.2 % |
15.1 % |
5.9 % |
| 2010 | Royals |
32.2 % |
29.4 % |
15.3 % |
10.9 % |
12.1 % |
|
| 2011 | Brewers |
45.4 % |
6.8 % |
19.1 % |
20.1 % |
8.7 % |
|
| 2012 | 2 Teams |
30.9 % |
19.5 % |
9.5 % |
15.1 % |
17.8 % |
7.2 % |
| 2013 | Dodgers |
29.1 % |
16.6 % |
22.3 % |
7.9 % |
12.4 % |
11.7 % |
| Total | Career |
45.8 % |
11.2 % |
2.9 % |
16.6 % |
14.9 % |
8.4 % |
According to Pitch F/X, Greinke has thrown his slider 1% of the time or less in his last three starts. So essentially zero.
Now, it could be possible that Pitch F/X is seeing the slider as a cutter. But Pitch F/X has differentiated these pitches in past games for Greinke. Plus, his cutter this season has an average velocity of 87.2, while his slider has an average velocity of 82.5. Could he be abandoning his slider for a pitch that is less stressful on his elbow, and yet designed for a similar purpose? The cutter could still move in to lefties and away to righties. But, is it working?
According to Pitch F/X pitch values, it is not. Greinke’s cutter is currently his worst pitch. In 2009, his best season, the slider was his best pitch. Now he may be abandoning it.
Maybe this change, along with the decreased velocity, is why Greinke is giving up a lot of line drives. Maybe pocketing the slider for the cutter is not allowing him to put hitters away, which is leading to the decrease in strikeouts. Maybe he is on the verge of significant decline or injury.
That last statement is difficult to predict. But there is another former Cy Young winner who has lost three miles per hour on his fastball since 2009, and his name is Roy Halladay. According to Pitch F/X, he didn’t throw a slider, but Roy did throw a cutter. A cutter he threw 40% of the time in 2012. He only threw it 21% of the time in 2013, but to be fair, Halladay normally threw his cutter about 25% of the time in his career. So 2012 is an outlier.
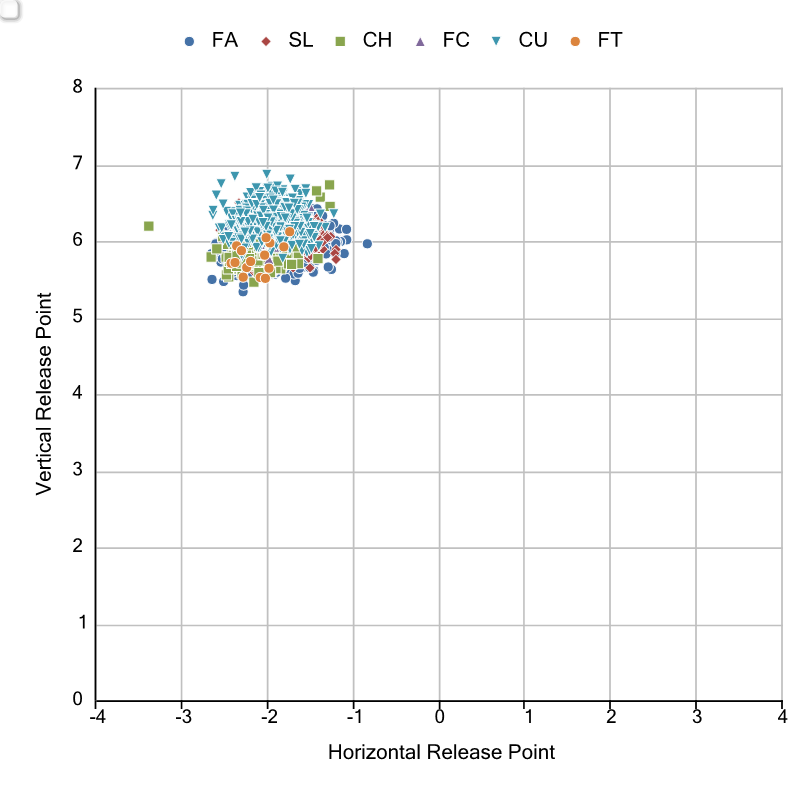
Here are Roy Halladay’s release point charts. On the left is his 2009 season, where his average fastball was 92.6MPH. On the right is his 2013 season, where he average 89.6 on the fastball.
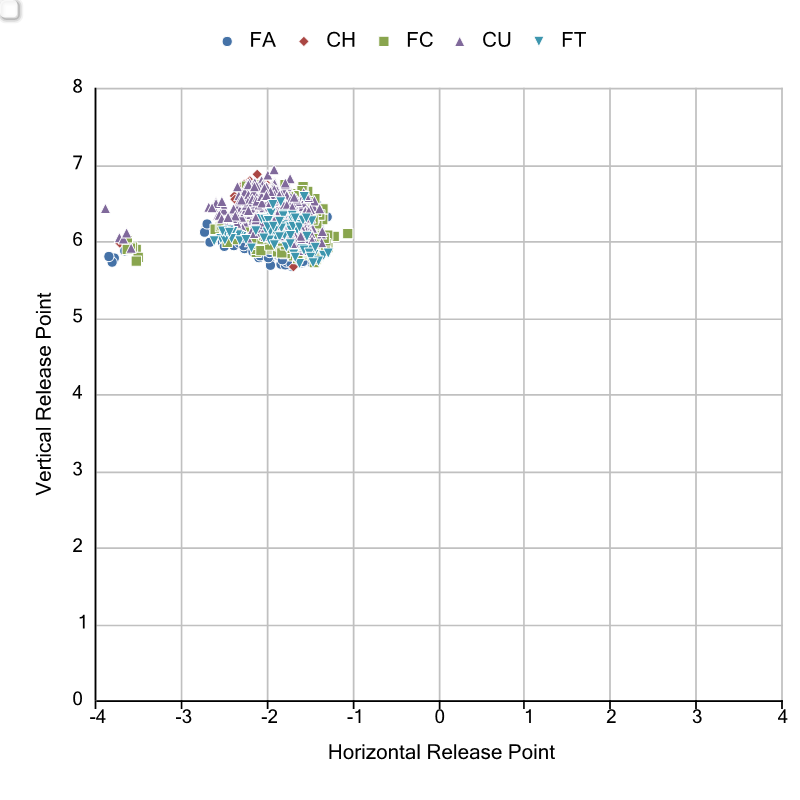
Notice the release point? Significantly lower in 2013 than in 2009. Roy Halladay is now in the disabled list for most, if not all of the season with a shoulder injury.
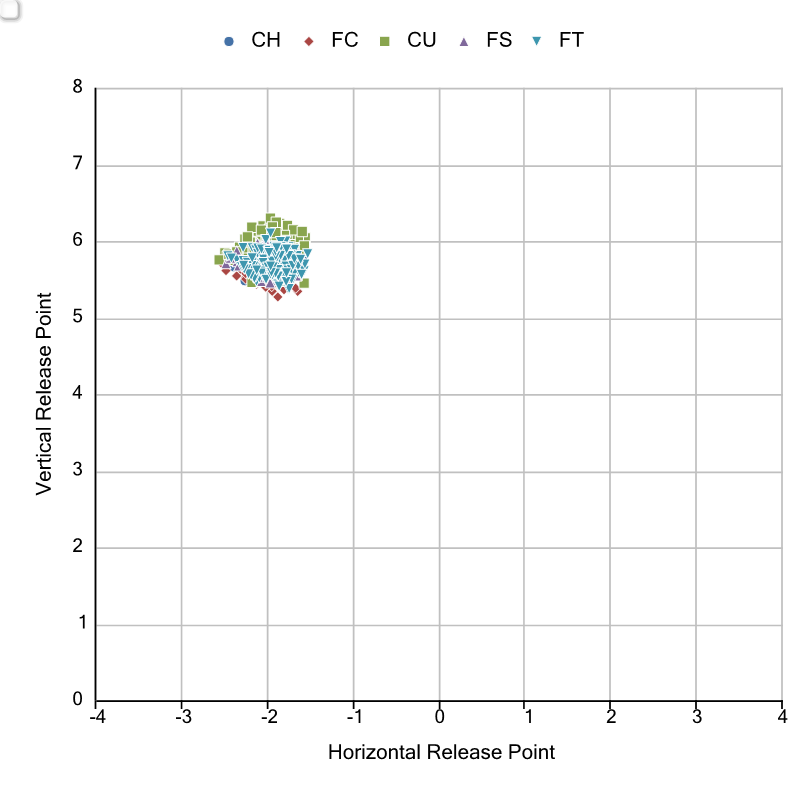
Here is a look at Zack Greinke’s release point chart. On the left is his 2009 season, where his average fastball was 93.7MPH. On the right, is his 2013 season, where he is averaging 90.7 on the fastball.
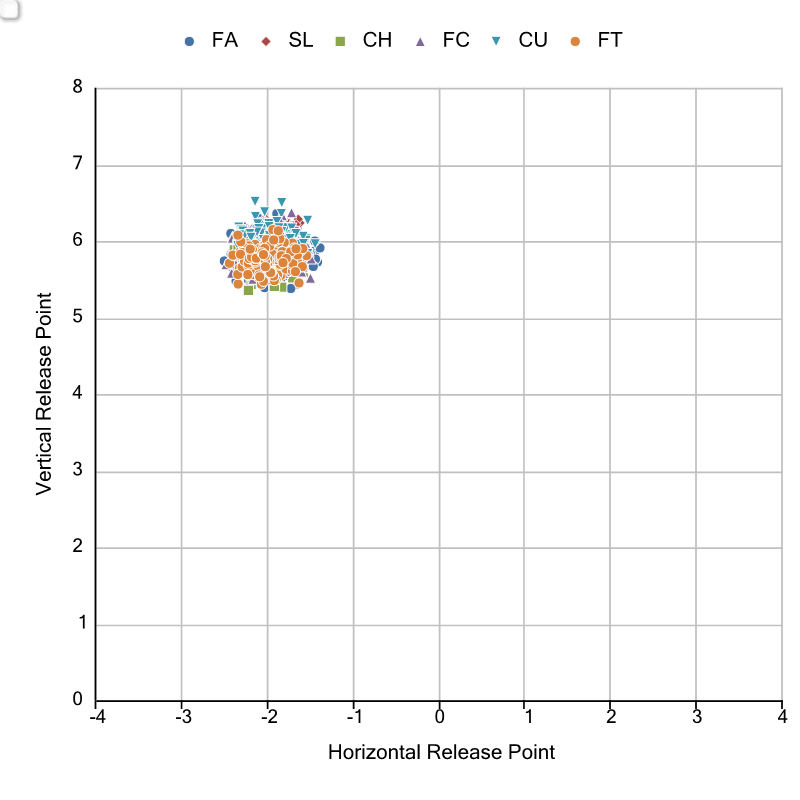
Not nearly as striking as Halladay’s release point chart, but you can still see Greinke’s release point is lower than where it was in the past. Compare these two pitchers to Justin Verlander. His release point charts are essentially the same since 2009.
This weekend, I traded for Zack Greinke. I did this knowing the warning signs. However, not every warning sign develops into the outcome you expect. And sometimes you can’t pass up potential in a buy low situation. I traded for a possible ace, and it was for a low price, with low risk. If the former Cy Young winner happens to turn this all around, and shows the warning signs are based on sample size and randomness, then I have a number two fantasy starter. Pitching in the NL with a home park that is good for pitchers doesn’t hurt, either.
In saying all that, if I could sell him to someone who is willing to give me top 35 pitcher value, I would. If you are in a dynasty league, I would consider moving Greinke before it’s too late. You are better off selling a player a year early, than a year too late. Predicting success or decline is not an easy thing to do. Predicting an injury is even tougher, if not impossible. And although I am not willing to declare that Greinke will be on the disabled list by the end of 2014, he has me very concerned, and I suggest owners who can trade him for good value, to do so. But there is a chance Zack Greinke reverts to his old self and rights the ship in 2013, so if someone is offering you 50 cents on the dollar, it may be in your best interest to hold and hope.
Thanks to Fangraphs.com for the data and release point charts.
Thanks to Jeff Zimmerman’s article and data, as well as thanks to baseballheatmaps.com.
Thanks to brooksbaseball.net for data.
Thanks to MLB for posting the youtube video.
[/am4show]