
2013 Fantasy Baseball, The Fielding Edge: Tampa Bay Rays and Boston Red Sox
Fielding analysis and fantasy sports don’t mix. At least, they don’t mix yet. A scant decade ago, fielding analysis and sabermetrics didn’t mix either and sabermetrics has always been on the sharp edge on the spear of thinking in the sport. Sabermetricians have always been about value. Simply put, they want to study that which has a direct impact on winning games. As an extension, fantasy players want to know what is going to help them win their fantasy leagues. Since fielding numbers are not among the categories in 99 percent of fantasy leagues, there seems to be no reason to study it.
Slowly but surely, fielding analysis became more and more mainstream among sabermetricians as they became more able to ascertain its value in terms of wins, losses, and more importantly, runs. While those categories don’t count for your fantasy baseball teams, teams are increasingly becoming more intelligent about which players save them the most runs with their gloves. Those players play more often and therefore have more opportunities to give you those numbers on the offensive side of the equation.
In this series, we are studying the playoff contenders for a few different reasons. First, they are more likely successful in the fielding department, so studying them enables us to study success. When you can break success down into smaller parts you can more easily see how success can be implemented elsewhere incrementally. Secondly, those teams are more likely to fill in holes in their lineup in advance of the non-waiver trade deadline. Sometimes, hitting is a consideration, but often the hidden aspect of fielding might be more important to them. Fielding affects pitching in ways people cannot even imagine. So, you can add pitching at the deadline or you can simply add better fielders and improve your entire pitching staff.
Today, we are comparing the Boston Red Sox and the Tampa Bay Rays to see if we can determine what their fielding needs might be and why both teams have been very successful in the AL East. With the exception of last season, both have been near the top of the division every year since 2008 for the Rays and further back for the Red Sox. Additionally, we will look at the squads overall to see if advanced strategy has anything to do with it.
For our purposes today, we will be using Fielding Bible data from John Dewan and billjamesonline.com. Dewan splits fielding into a +/- category and a runs saved category. The +/- category is a simple representation of whether the player made more plays than the average player given his opportunities or fewer plays. Interns spend hours poring over film to categorize the difficulty of each play and the likelihood that a typical player at that position would actually make the play. From there, run values are assigned depending on the possible outcomes of making or not making the play. Usually, looking at these numbers alone will tell us everything, but in the case of the Rays and Red Sox it will not.
Boston Red Sox
|
INN |
+/- |
Runs |
||
| C | Jarrod Saltalamacchia |
600 |
—- |
-8 |
| 1B | Mike Napoli |
687 |
+9 |
+7 |
| 2B | Dustin Pedroia |
842 |
+13 |
+12 |
| 3B | Will Middlebrooks* |
461 |
-5 |
-5 |
| SS | Stephen Drew |
575 |
+6 |
+2 |
| LF | Daniel Nava |
692 |
-8 |
-3 |
| CF | Jacoby Ellsbury |
787 |
+12 |
+8 |
| RF | Shane Victorino |
519 |
+17 |
+14 |
| Total |
5163 |
+44 |
+27 |
Will Middlebrooks is down on the farm largely because he couldn’t hit his weight, but the fielding numbers above certainly didn’t help. Additionally, Ryan Lavarnway has been playing more often behind the dish largely because of the numbers we see above. That is a terrific example of the hidden effects that fielding has on playing time and therefore on a player’s fantasy value. What’s increasingly interesting though is looking at the overall effectiveness of a defense.
Defense Efficiency Rating is a very easy metric to compile. It looks complicated, but it simply calculates the percentage of balls in play (excluding home runs, walks, strikeouts, and hit by pitches) that are converted into outs. Typically, we would expect 30 percent of balls in play to become either hits or errors. Therefore, an average defense efficiency rating (DER) would be .700. The Red Sox are showing tremendous range by making a combined 44 more plays than average and saving 27 more runs than average. However, their overall DER is a measly .689. That can happen for a number of reasons. The main reason is that they may not be taking full advantage of their collective range through poor pre-pitch positioning. However, it should be noted that the above numbers do not represent the collective fielding numbers of all of the pitchers and the reserves. A comprehensive study of those numbers might bring the team down a peg or three.
The Rays sport a DER of .708 and while it may not be the best in the league, it is consistent of where the team has been over the past several years. The Rays have been known for being on the cutting edge in their use of defensive shifts. To put it bluntly, they shift for every single hitter based on a comprehensive study of where he normally hits the ball. It has been widely successful and is beginning to be copied by a number of other organizations. So, while their numbers below might look pedestrian we must remember what the overall goal is.
Tampa Bay Rays
|
INN |
+/- |
Runs |
||
| C | Jose Molina |
444 |
—- |
-4 |
| 1B | James Loney |
758 |
-1 |
+1 |
| 2B | Ben Zobrist |
794 |
-6 |
-4 |
| 3B | Evan Longoria |
724 |
+4 |
+6 |
| SS | Yunel Escobar |
789 |
+11 |
+8 |
| LF | Matt Joyce |
572 |
-8 |
-8 |
| CF | Desmond Jennings |
788 |
+2 |
0 |
| RF | Wil Myers |
215 |
+3 |
+2 |
| Total |
5084 |
+5 |
+1 |
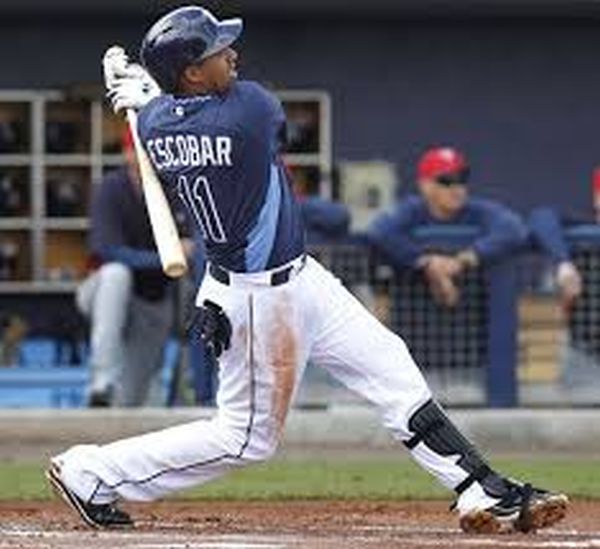
As you can see, the Rays don’t look great individually. Yunel Escobar is the only fielder that really stands out on the positive end. Yet, he is another great example of the hidden value of fielding. The Rays and Joe Maddon were willing to sit through a horrific April because he gave them so much value on the other end. Overall, there is very little that either team wants to do defensively with the exception of third base for the Red Sox.
Yet, this is a fantastic study in how overall strategy can have a profound impact on your defensive numbers as a team and therefore your pitching staff. The Rays are constantly outperforming their fielding independent pitching (FIP) numbers because of their superlative overall team defense. So, even if the individual parts don’t add up to a great defense like we might believe with the Red Sox, the Rays are better off overall.
2 Comments
So, one must have realized bby now that this charger is a greatt
thing to have. In the Conjugation States, Hoover clay one of the leading manufacturers of family goods, including vacuum
cleaners; and Hoover became selfsame loaded from the
innovation. It is easier to prevent this inconvenience with better planning by looking at the benefits of using a portable air conditioner.
In Bout #8, it was the slick Richard Cumpson (Wedding MT) going up against Michael
Jaegar (Extreme Power) in the 155 pound weight class.
4) Zinc heightens your energy, speed along with dexterity.
, on Day 1 you begin by using a series of tempo runs, sprints and low-intensity plyos
(after the proper warm-up of course).