
2014 Fantasy Baseball: Andrew Cashner Is Getting Better
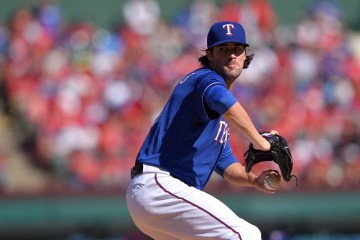
Andrew Casher, one of the unluckiest people in the game – except for Rich Harden, Mark Prior, and Grady Sizemore – was finally able to stay on the field for a substantial amount of time in 2013. Glimpses of his ability had been seen in the minors and, to some extent, the major leagues. Last season, we were finally able to see Cashner’s ability over the course of an extended workload. For the most part, he was really good. He was really good at run prevention, getting groundballs, and limiting free passes. On the other hand, he wasn’t very good – at least not until late in the second half – at what was supposed to be his bread and butter; striking out opposing batters.
Cashner’s 2013 started off like most years do with him with concerns about injuries. Cashner’s preparation for the season was pushed back indefinitely after an unfortunate incident with a hunting knife. As a result, he had to be eased into the season through the bullpen. Near the end of April – the 20th to be exact – Cashner was firmly installed in San Diego’s rotation, and he did not disappoint.
Everything is a Work in Progress

You can see for yourself how good he was above, but on an even more encouraging note, look how much stronger his numbers got as the season marched into the dog days of summer.
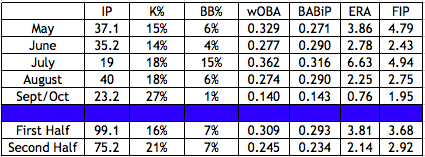
Please note that I did not include March & April due to the fact that Cashner only registered 10 innings as a starting pitcher. Besides the hiccup in July, Cashner improved nearly every month – especially in regards to punching out the opposition. I’ll admit it now, I had no idea Cashner possessed the command that he showed in 2013 – save July.
The first thing I want to focus on is the increase in strikeout percentage. Run prevention is wonderful, but if Cashner is able to couple run prevention with an above league average strikeout rate, we’re looking at an enormous talent.
Cashner’s always been known for his heat. And after striking out 26.5% of opposing batters using mainly nearly triple digit heat, it’s not hard to see why. However, in scouting circles he’s also been widely acclaimed for his ability to spin some incredibly good breaking stuff. From 2011 – 2012, Cashner’s slider averaged ~86 mph, and he only threw a curveball once. In 2013, Cashner’s slider averaged ~83 mph, but a curveball began showing up on BrooksBaseball averaging ~80 mph. It appears that there may have been some clarification issues. Luckily for us, Corey Block, a beat writer from San Diego, answered the question regarding his slider for us. According to a piece from last May, Cashner’s go-to slider was a “knuckle-slider,” while a traditional slider was still being worked on.
Aside from velocity, is the pitch really any different? In some ways yes, in others, no. According to Fangraphs, Cashner’s swinging strike rate on his slider in 2012 was 13.1%. In 2013, it was 13.6%. All good there. One negative noticeable trait however, is that hitters were able to lay off more sliders out of the zone in 2013 (~30% o-swing in 2013 versus ~33% in 2012). But as we head back to the positive side of the glass, hitters saw their contact rate on sliders in the strike zone fall ~8%. In order to illustrate the difference, look at the GIFs below, provided once again by the wonderful folks at Fangraphs.
As you can see, this pitch bites quickly absolutely disappears. Nearly impossible to hit.
As you can see, this pitch isn’t quite as sharp, and honestly it could just be a hanging breaking ball. However, it was classified as a slider, so we’ll go with it. Is this the knuckle-slider, by chance? Or is it just the curveball that began showing up on his Brooks page in 2013? Who knows. What we do know, however, is that Cashner didn’t feel comfortable with his slider until late in the season. Again, credit to Corey Block:
Cashner also switched to a more traditional grip on his slider and wasn’t afraid to use his changeup in different counts. That four-pitch mix caused trouble for the opposition.
“I think I had trouble getting over the top of my slider. At times, it felt like it was never there, like I was searching for it the whole first half,” Cashner said in a conference call. “Working with Balsley, talking to [teammate] Tyson Ross about how he threw his slider … that’s when things changed.”
So it appears that the knuckle-slider, is no more. It was obviously a welcome change because once the second half rolled around, Cashner really, really upped his usage of the pitch.
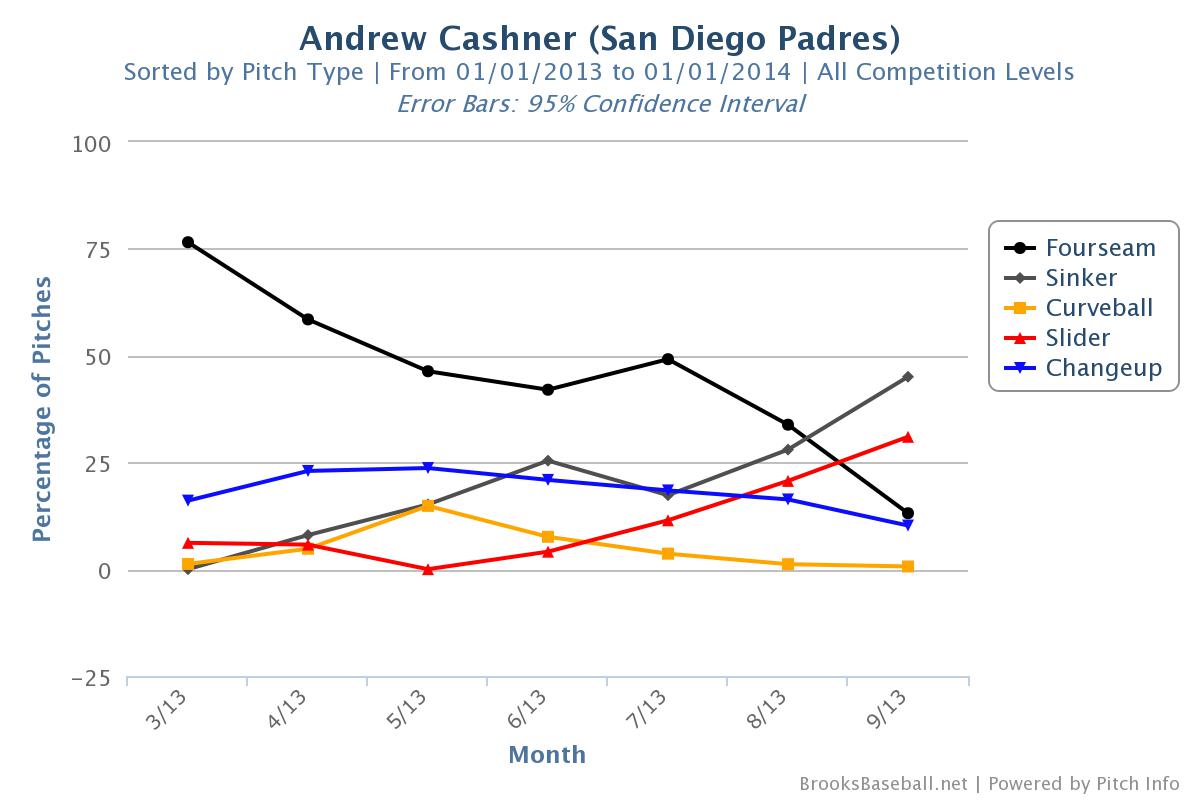
The knuckle-slider, which could be classified here as a “curveball” was non-existent in the second half while usage of the slider spiked tremendously. When Cashner’s slider is on, it’s devastating. Obviously something the Padres’ pitching coach, Darren Balsley, is doing is working because both Cashner and Tyson Ross turned in phenomenal second halves and both have their slider to ultimately thank for it.
Refer back to the chart above and notice the use of Cashner’s sinker. His usage of the sinker climbed, in a similar fashion to his slider, while his four seam usage declined. It was by design. Once again, Corey Block reports:
Cashner said his rise started about halfway through the season, when he challenged himself in each start to using his fastball more, a sinker that proved devastating at times. Cashner credited his pitching coach, Darren Balsley, on Wednesday for his development.
Cashner made a conscious effort to get ground balls, keep the ball in the yard and become more efficient. His ground ball rate hovered around 53%, which is right in line with his career, but the other two were definitely accomplished. In 2013, Cashner averaged 3.8 pitches per batter, down from ~4 pitches per batter in 2012. It’s not a tremendous change, but it’s a change nonetheless. On the home run front, Cashner improved tremendously. In 2012, Cashner allowed 5 home runs in 46.1 innings, or .97 per nine innings. In 2013, Cashner allowed 12 homers in 175 innings, or .67 per nine innings.
Of the five homers Cashner allowed in 2012, 4 came off of his four seam fastball, which he used ~60% of the time. Fast forward to 2013, five homers off of his four seam offering, five off of his change-up, one off of his slider, and one off of his sinker. We’re dealing with small samples, but it’s fairly obvious that his sinker is much tougher to get out of the yard. Cashner’s decision to become more efficient might have cost him a few whiffs early on, but it did wonders for his run prevention.
It gets a little complicated once we split Cashner’s fastball offerings between the handedness of batters. Lefties hit his sinker better, while righties hit his fourseam better. As you’d expect, Cashner’s approach changed a little once his sinker usage spiked.
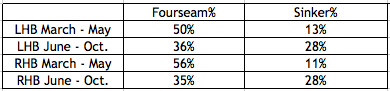
Despite the fact that lefties hit his sinker better, they still saw more of them. However, they fared markedly worse after June began than they did up until May. After posting a .444 average, a .722 slugging percentage and a .278 ISO on a .412 BABiP from March until May, opposing batters numbers dropped off of a cliff, partly because they couldn’t possibly go any higher. From June on, left handed batters had a batting average of .265 versus his sinker, slugged .367 and posted an ISO of .102 with a .302 BABiP.
His approach, as far as the strike zone is concerned, didn’t change a great amount, so part of the change can simply be chalked up to regression to the mean.
Pitchers are ever evolving. Cashner’s 2013 shows just how much a few changes can matter. By harnessing his slider and relying on his sinker more, Cashner was able to go fairly deep into games, averaging ~6.1 innings per start. The strikeouts weren’t there in the beginning, but they eventually showed up. Cashner’s newfound confidence was on display during the last two months of the season when he absolutely dominated with the pitch posting a ~20% whiff rate.
2014 Value and Expectations
They’re not extremely similar pitchers, but Andrew Cashner, or at least the coverage around him, reminds me somewhat of Gerrit Cole. The questions are the same. “Why aren’t these guys getting more strikeouts despite their stuff?” Well, we now know why Cashner wasn’t getting as many. He wasn’t utilizing his best pitch for getting whiffs for multiple reasons, the main two being confidence and efficiency. Similar to Cole, Cashner realized the potential for strikeouts and pounced in the second half. His 2014 projections take that information into account, although I believe there is a little room for growth.
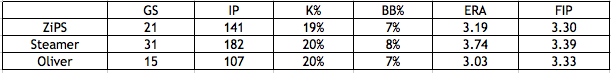
Every projection system above, except for Steamer, is hesitant to project too many innings given Cashner’s injury history. His rate stats, however, project nicely and give a realistic baseline for his performance. I believe a little more in his ability to strike out opposing hitters going forward given the information provided above. Let’s call it 22% on the strikeout rate, which is closer to his second half but also close to projections. Converted to strikeouts per nine innings, his second half came in at 7.26, which is a little above the NL average for starters but isn’t near Cashner’s potential.
Cashner’s BABiP, which was .269, was below league average, but given his ability to get ground balls and his rather solid infield defense, I’d hold off on saying that improvement was solely luck related. Cashner’s BABiP in 2012 was above league average, so we have one season of relative good luck and one season of relative bad luck. The projection systems above see Cashner’s BABiP in the .285 range, so he’s projected to hold hitters to a little below league average BABiP going forward.
Best of all, Cashner calls Petco Park home. He did have a sizable home/road split last season, but I’d like to see a little more going forward before I’m willing to call him a product of Petco. As of now, Cashner is the 36th starting pitcher off the board in NFBC drafts, right in front of Jon Lester, Francisco Liriano, and Patrick Corbin. On ESPN, he’s ranked 38th, around the same names. Both seem completely fair to me. The ranking on both sites is fair, but I believe there’s room for growth. If Cashner is able to prevent runs near the same level and add a few more strikeouts, we’re looking at a top-30, perhaps top-25 starter.
Andrew Cashner is one of my favorite upside picks in 2014. His pedigree and potential make him one of the most likely rotation anchors not currently being taken in the top-25, in my opinion. I’ll be watching him closely on draft day, you should as well.
As always, thanks to Fangraphs, Baseball Reference, and Brooks Baseball for the wonderful, and best of all, free, data.