
2014 Fantasy Baseball: Second Tier National League Starting Pitchers
Yesterday, we began taking a look at National League only starting pitching prospects. The general idea was to split the starters into three tiers based on their Fair Run Averages (FRA) from the previous season. Pitchers with FRAs under 4.00 were in the first tier. Today, we will look at pitchers with FRAs between 4.00 and 4.50. The general idea is that pitchers with those particular FRAs will share many of the same characteristics. So, you can find good bargains if you look for certain characteristics. As we will see today, you can avoid reaching for starters by also paying attention to those same characteristics.
The fielding independent pitching (FIP) revolution has done a pretty good job of predicting future performance. FIP has evolved into various other forms like FIP+, FRA, and SIERA. It all depends what your source is. Our particular source is Baseball Prospectus, but you will see some of these other numbers at Fangraphs and Baseball-reference.com as well. The concept is the same. The idea here is to see if we can predict where a player will wind up in FRA based on the various components of their other statistics.
While the group will always have strong characteristics one way or the other, individual pitchers within the group may actually better match the first tier or the third tier respectively. Even though just about everyone has already had their draft, there are pitchers on the waiver wire, available via trade, and as you see every day on our site, there are daily games that require you to make evaluations throughout the year. Early on, we look at the previous season for answers more than the current season.
If you are just joining us, we will look at pitchers that hurled more than 100 innings in 2013 and group them based on their FRA. From there, we will look at the group averages in games started, innings pitched, FRA, ground ball rate, strikeouts per nine innings, and walks per nine innings. Some believe that the last three numbers are excellent predictors for Fair Run Average. We will test that theory and then also look at players in the second tier that most people thought were first tier guys. Maybe that placement was an aberration or maybe we should steer clear of these pitchers early on in the draft process. If you own them, you may be able to deal them early before others catch on.
|
Pitchers |
GS |
INN |
FRA |
GB% |
SO/9 |
BB/9 |
|
| Tier One |
24 |
32.4 |
191.0 |
3.76 |
48.3 |
8.0 |
2.5 |
| Tier Two |
19 |
25.6 |
165.1 |
4.26 |
47.2 |
7.1 |
2.6 |
| Tier Three |
17 |
26.3 |
156.5 |
4.88 |
48.5 |
6.6 |
2.9 |
When looking at the above table (the same as yesterday’s), the key is to look where would see a noticeable difference between the three tiers. What we notice is that the only real difference is a difference in strikeout and walk rates. That is no surprise. It also isn’t a surprise to see tier one starters getting more starts and hurling more innings. The surprise is probably that there is little to any difference in the average ground ball rates of any of the NL starters.
This is important when one is looking to identify sleeper candidates. Some organizations seem to favor ground ball pitchers because they would be more likely to avoid giving up a lot of home runs. That’s fair, but their success also largely depends on the fielders behind them. So, rather than hunting down pitchers with low or high ground ball rates, you should look at each individual team and the various strengths and weaknesses of their fielders. If they are a strong outfield fielding team then it might be a good idea to look for a lower ground ball rate for that particular staff. We will be looking at the various teams’ strengths and weaknesses later on during the week. Looking at each team will tell us more than looking at any individual pitcher in a vacuum.
So, today, we are looking at pitchers that some fantasy fans see as top tier starters, but actually are closer to the third tier than they are the first tier. Sometimes there are underlying reasons for that and sometimes they just had a down year in the luck department. We will look at the relevant numbers to see which category each fits into.
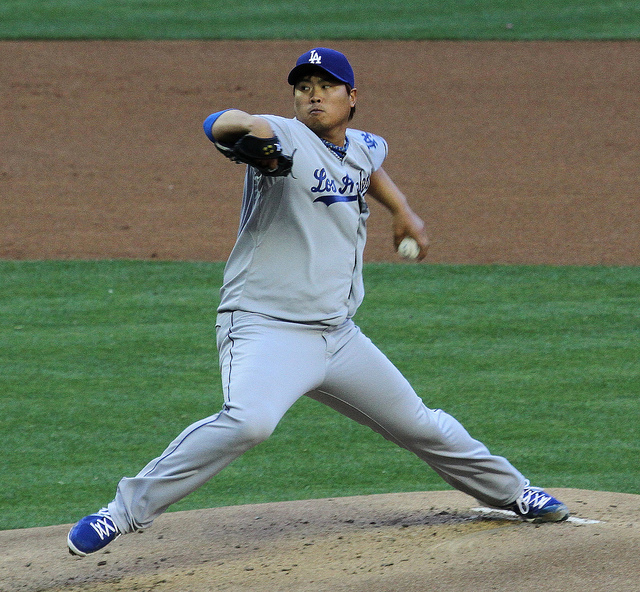
Dan Haren—Los Angeles Dodgers
ERA: 4.67 SO/9: 8.0
FRA: 4.47 BB/9: 1.6
INN: 169.7 BABIP: .302
GB%: 39% LOB%: 70.3
Haren has the strikeout rate and walk rate of a tier one starter, but he fell just a little short of going into their three. The low ground ball rate might have been responsible, but now he is a Dodger. Dodger Stadium is fairly friendly to fly ball pitchers and the defensive outfield has the potential to be good in Los Angeles. So, he might actually be a good regression candidate. If you are playing daily baseball, you might think about starting him while his price is depressed.
Matt Cain—San Francisco Giants
ERA: 4.00 SO/9: 7.7
FRA: 4.47 BB/9: 2.7
INN: 184.3 BABIP: .260
GB%: 39% LOB%: 71.6
When talking with a Giants fan, I came to realize they actually have a term inspired by Matt Cain. When a pitcher pitches a quality start and gets no run support they are said to be “Cained”. Last year, the term was used when a pitcher was clicking along until they had one disastrous inning. Overall numbers indicate that Cain should slip again, but he does have an impressive strikeout to walk ratio. So, if we average out those factors maybe he deserves to be right where he is at. He is just one of those guys that is hard to pinpoint right now.
Travis Wood—Chicago Cubs
ERA: 3.11 SO/9: 6.5
FRA: 4.43 BB/9: 3.0
INN: 200.0 BABIP: .248
GB%: 35% LOB%: 77.4
I thought the Cubs were stupid to trade Sean Marshall for Wood, but 2013 was a much better year for Wood than it was for Marshall. Considering Marshall is already on the shelf, 2014 would seem to be a repeat. That being said, Wood’s BABIP and LOB% would indicate that he is a huge regression candidate. 200 inning starters don’t exactly grow on trees, so Wood has some fantasy value, but if you drafted him based on his 2013 numbers then you need to look to deal him immediately. If you took him late then he still might be a decent value.
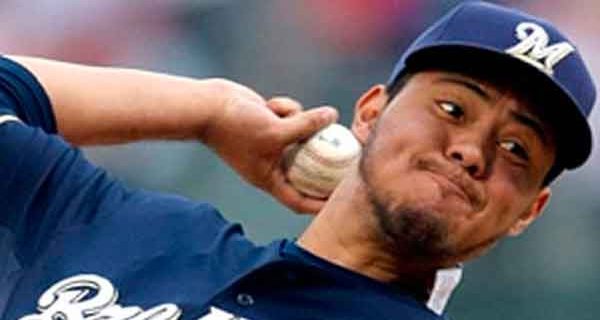
Yovani Gallardo—Milwaukee Brewers
ERA: 4.18 SO/9: 7.2
FRA: 4.49 BB/9: 3.3
INN: 180.7 BABIP: .299
GB%: 51% LOB%: 70.2
The numbers say he is right around where he should be as a pitcher. A scant two years ago, he was considered a borderline fantasy ace. Now, he is a borderline fantasy starter. The Brewers seem to be employing a group of these guys. I suppose the whole idea is that one or two of them could get hot and pitch above their pedigree. If that happens they suddenly become playoff contenders. Still, without a legitimate ace you wonder how far a team like that could go. As a fifth or sixth fantasy starter, he would be an asset to your team. Otherwise, I would stay clear.
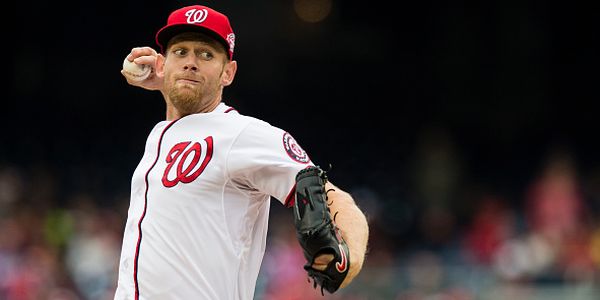
Stephen Strasburg—Washington Nationals
ERA: 3.00 SO/9: 9.4
FRA: 4.12 BB/9: 2.8
INN: 183.0 BABIP: .263
GB%: 52% LOB%: 73.2
If Strasburg were a girl, he would be the girl that the entire school wanted to take to the prom. She would look good and everyone would just drool at the thought of going out with her. Yet, when the time finally came they would come away disappointed. Strasburg is a tease. Mind you, I would love to have him on my real team, but everyone keeps waiting for him to bust out and win the Cy Young. I’m right there with everyone. My head tells me to look at the numbers and remember that he is more likely to get worse than better. My heart tells me to look at the stuff and all of that potential. Fantasy championships are rarely won with the heart